Project Summary
Introduction
The Dependency Clock, developed during the Graphic Design 2 course at OCAD University, reimagines timekeeping by visualizing personal and communal events. The exercise began as a response to the prompt “imagine timekeeping if clocks never existed,” and evolved into a tool for self-analysis and community insights. The project features customizable event tracking, adaptive zoom, and an interactive interface designed using Figma. By centering human-centered design, UX principles, and practical problem-solving, the Dependency Clock offers a prototype that encourages self-reflection and a community-focused approach to timekeeping.
Objective
The objective of this exercise was to design an interactive digital prototype that could be used by the general public to tell time. The prototype needed to function on both macro and micro time scales. Additionally, it had to use a deliberately unconventional timekeeping system that did not rely on seconds, minutes, hours, days, or years.

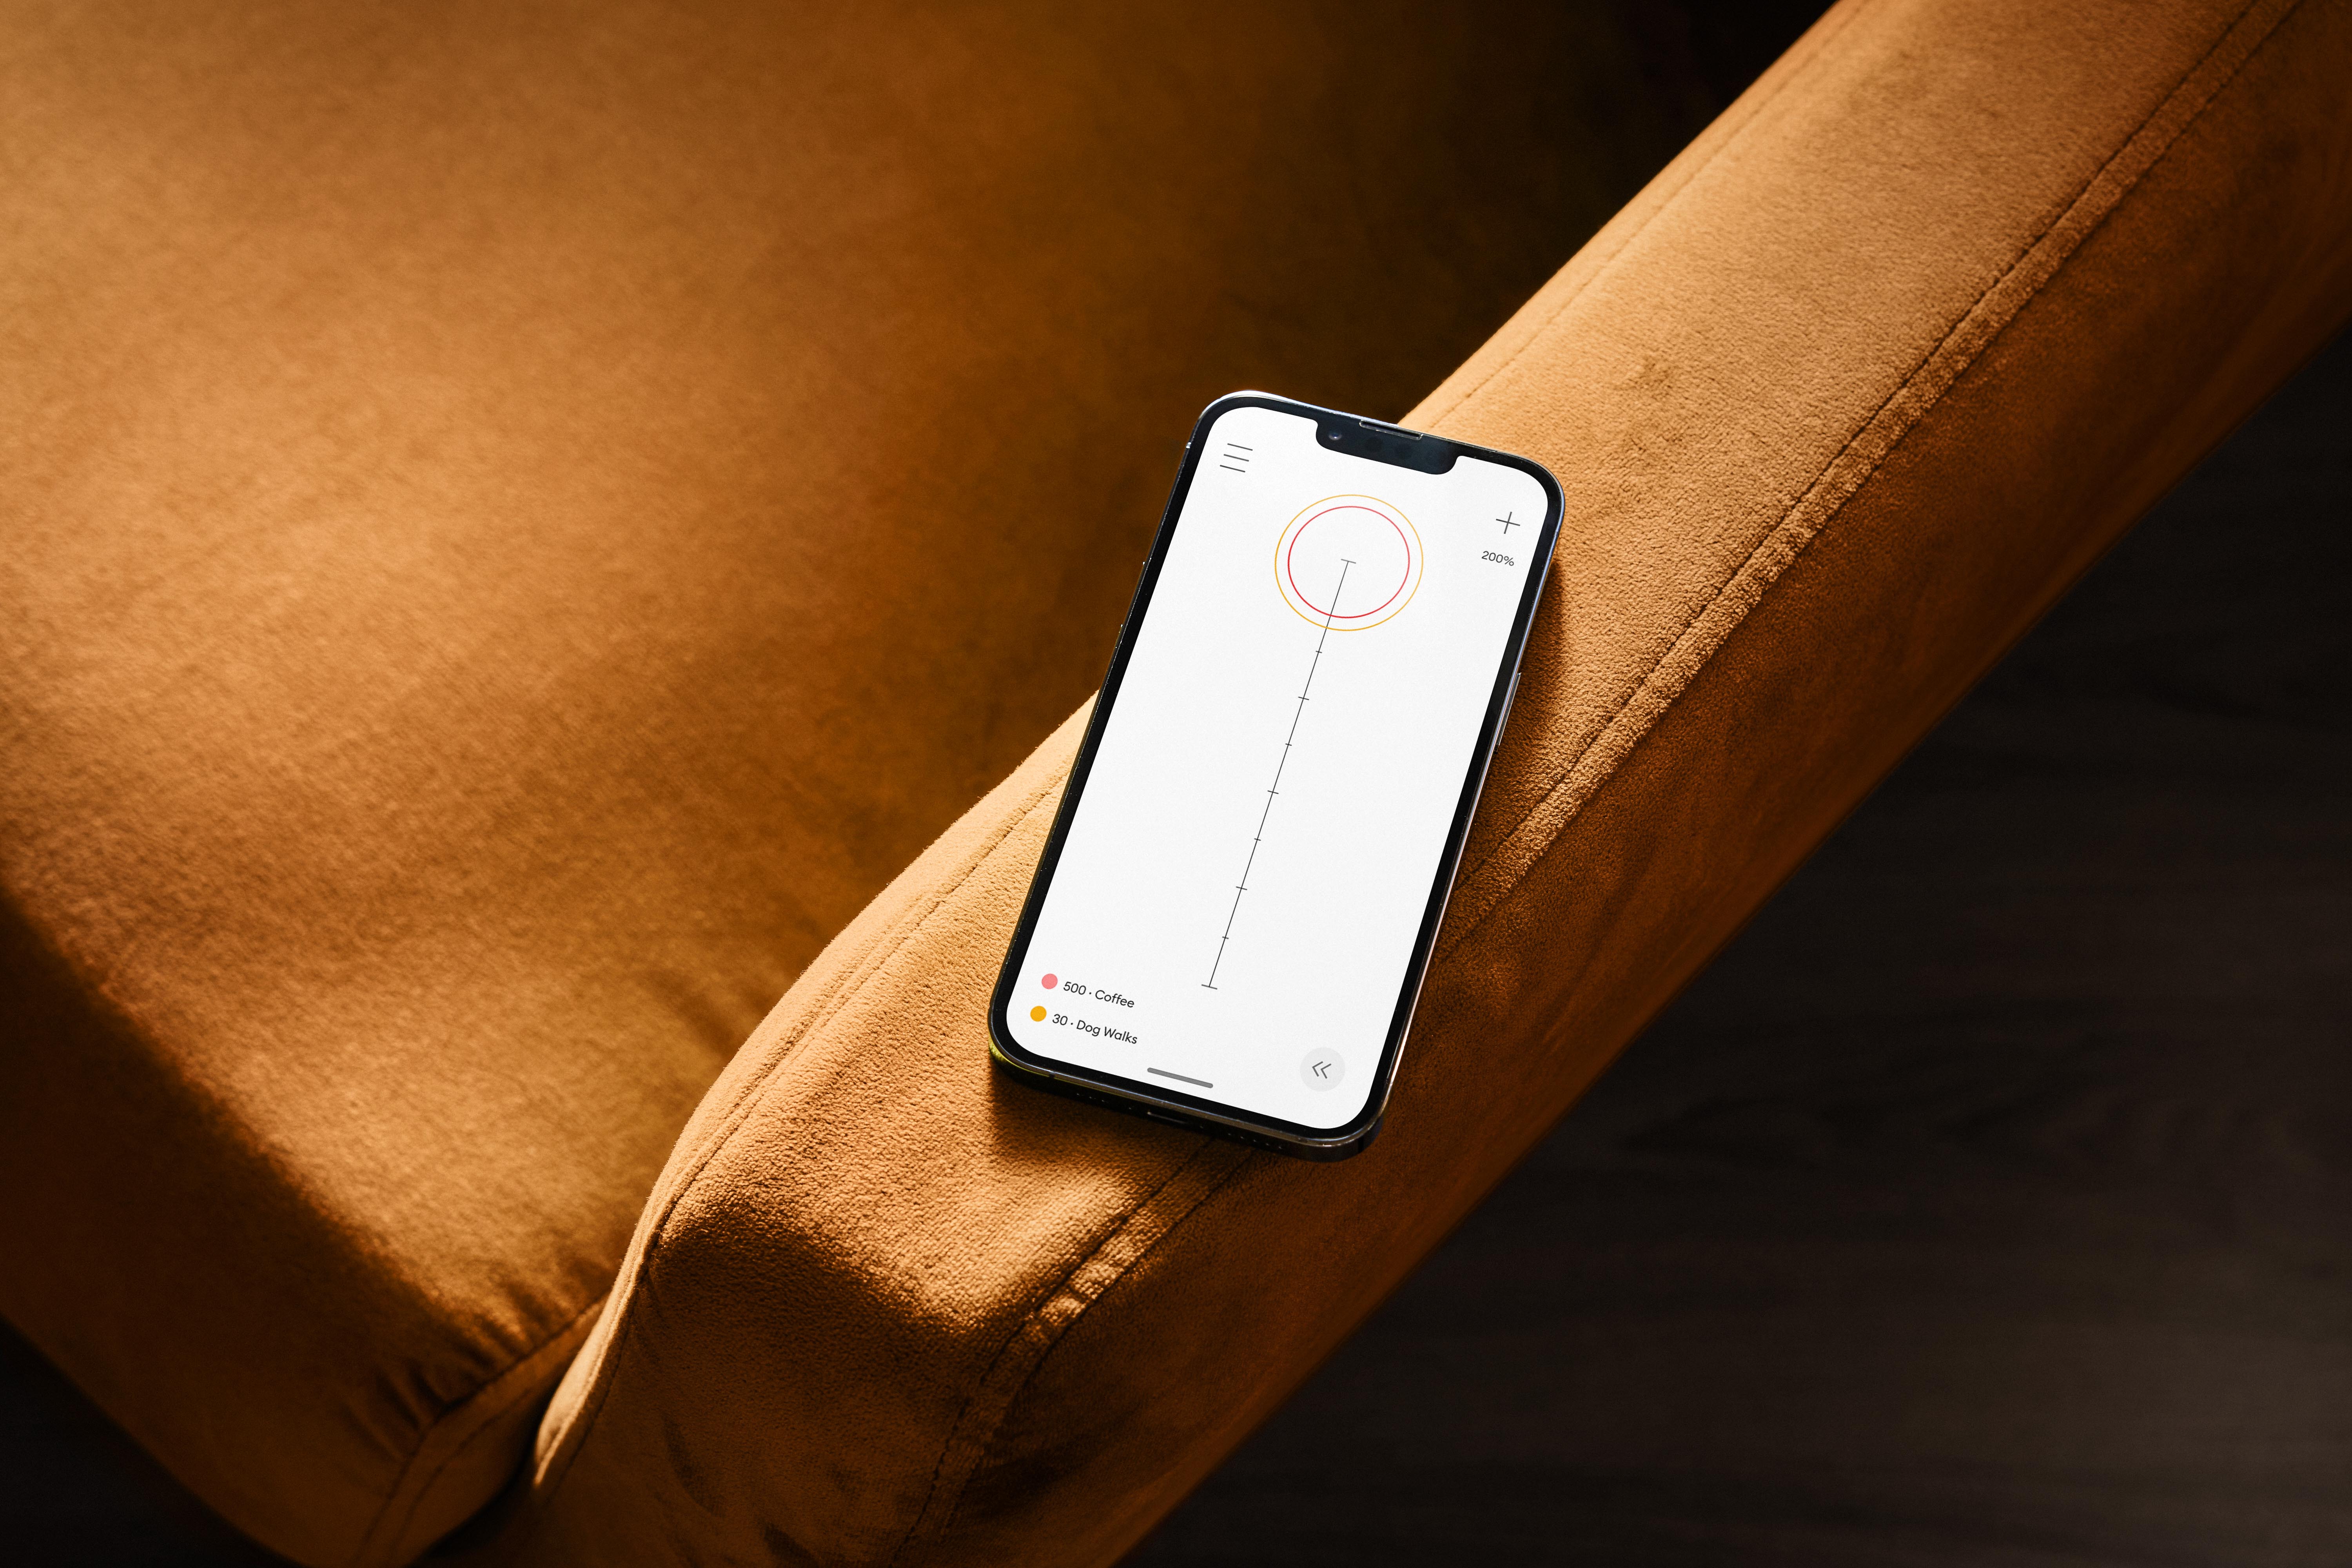
This image displays a mockup of the dependency tracking screen. Users can add or remove dependencies, which are then tracked by the clock. The display shows the 5 most frequently used dependencies in the "On Display/Recent" menu, with the history shown below. The dependencies chosen to be tracked by the application will be displayed as oscillating circles on the main display.
How it Works
Using the Clock
Creating Dependencies
Users use the application to map cycles based around events in their lives.
These mapped cycles are the dependencies and are available to all users.
Using Dependencies
Users select dependencies to be displayed on the main screen.
These dependencies are visualized as rings that oscillate in size between the minimum and maximum size showing each cycle
When a full cycle is completed the counter increases by one
Telling Time
Users tell time by navigating the relationships between rings, be it 2 or more rings, or the relationship of rings to the scale.
To communicate a time you must describe the relationship between the ring(s) forcing communication around time to be relative to perceived events.
Examples
Example 1 (Short Scale)
My caffeine intake as time
Mapping the Cycle: I chart my daily coffee intake beginning with my morning cup, a second at lunch, it dips slightly after this, and then peaks soon after my afternoon cup. This cycle, representing 0-100, gradually declines to zero overnight, resetting before my morning cup which adds a 1 to the counter.
Telling time: To communicate with others, you would say something along the lines of “We can schedule a meeting just before Greg’s caffeine peak—say, 95?” or “I finish work mid caffeine decline, I’ll be home when it reaches about 20.”
Example 2 (Medium Scale)
Gardening
Dependency used: Yearly Frosts
Telling Time: “It looks like the yearly frost ring is almost at zero, It should only be a few days until I can plant my seedlings.”
Example 3 (Long Scale)
Anticipated Album
Dependency used: Concordia MFA programs
Telling Time: “Its been almost 4 cycles of the Concordia MFA program, you’d think they would come out with a new album by now, right? I mean, it is getting ridiculous"
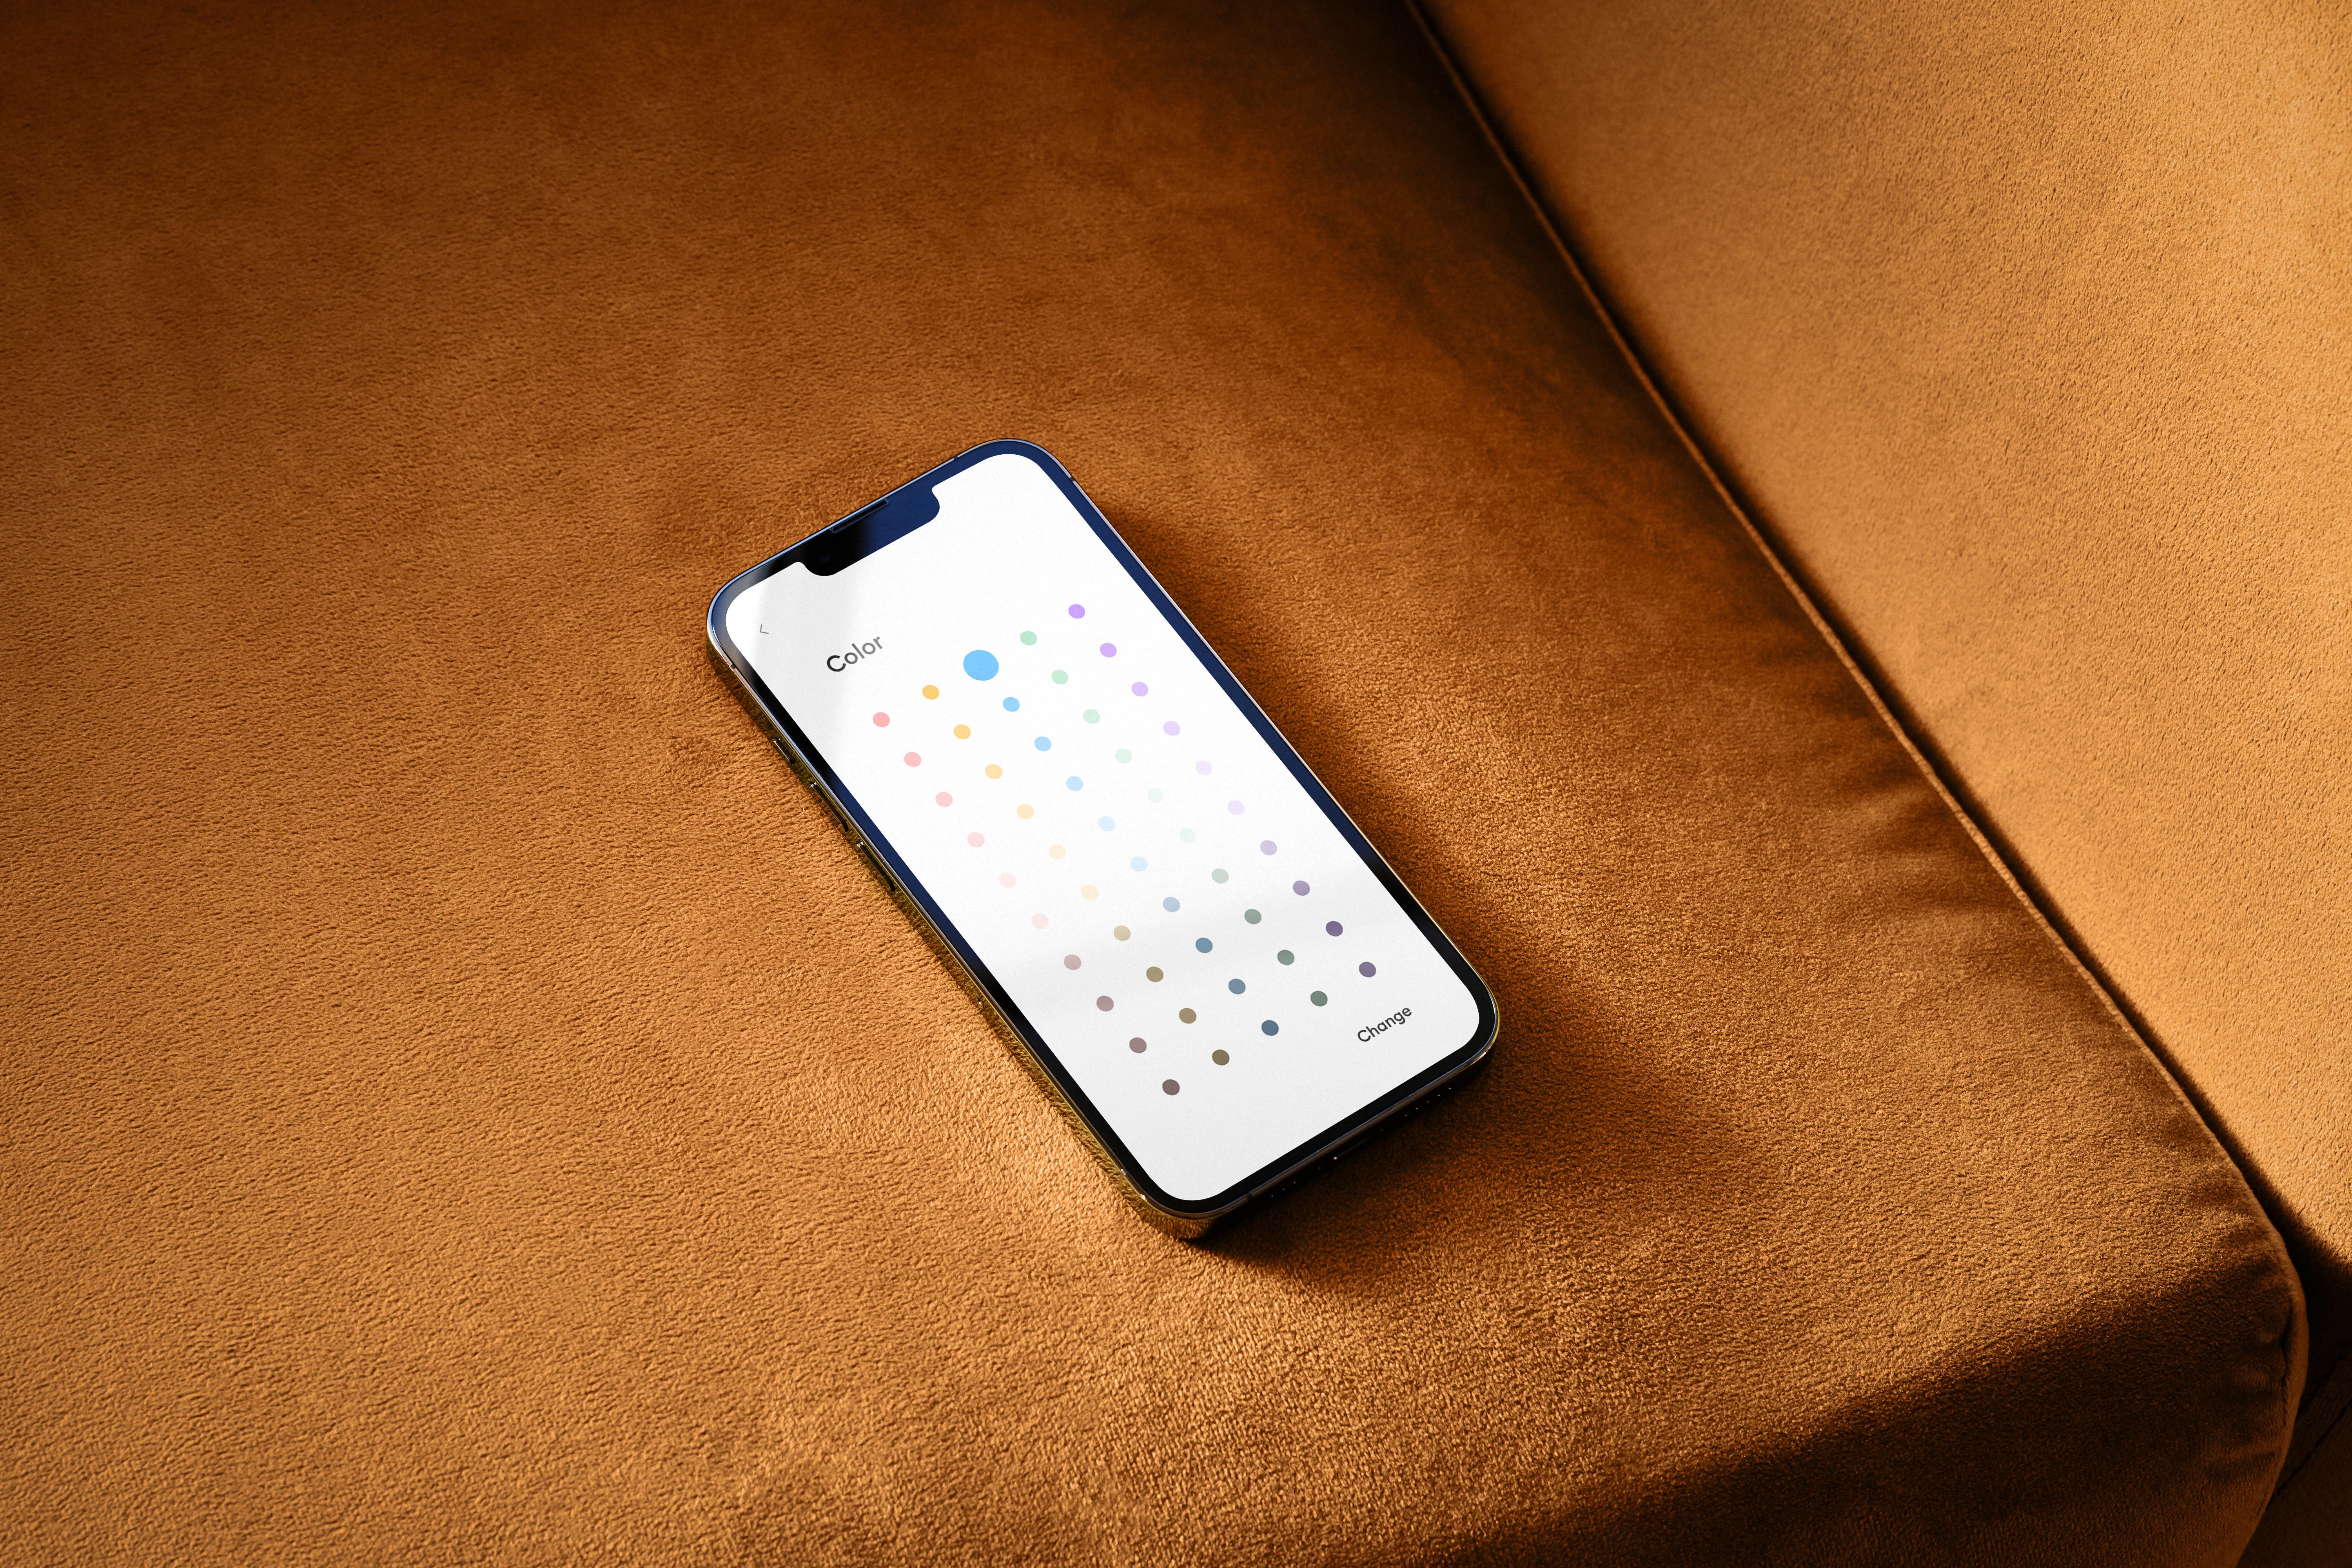
This mockup shows the color selection screen when designing a dependency ring. Part of a user flow that allows for mapping the parameters of the cycles and how the appearance rings.
Next Steps
To enhance the user experience, it is essential to focus on the following key areas:
Redesigning the workflow for constructing dependency rings to optimize the process.
Revising the terminology for clock elements to improve clarity and comprehension.
Developing a more intuitive onboarding flow to facilitate user adoption.
Further user testing will be crucial in refining these improvements and ensuring a seamless user experience.
For additional information or to discuss this project further, feel free to reach out via the contact info on the about page. Your feedback and inquiries are always welcome!
All content Copyright Greg McCarthy © All rights reserved.